The ASX is typically highly correlated to the US stock market (S&P 500) with the opening level of the ASX often determined by what the US markets did the previous night.
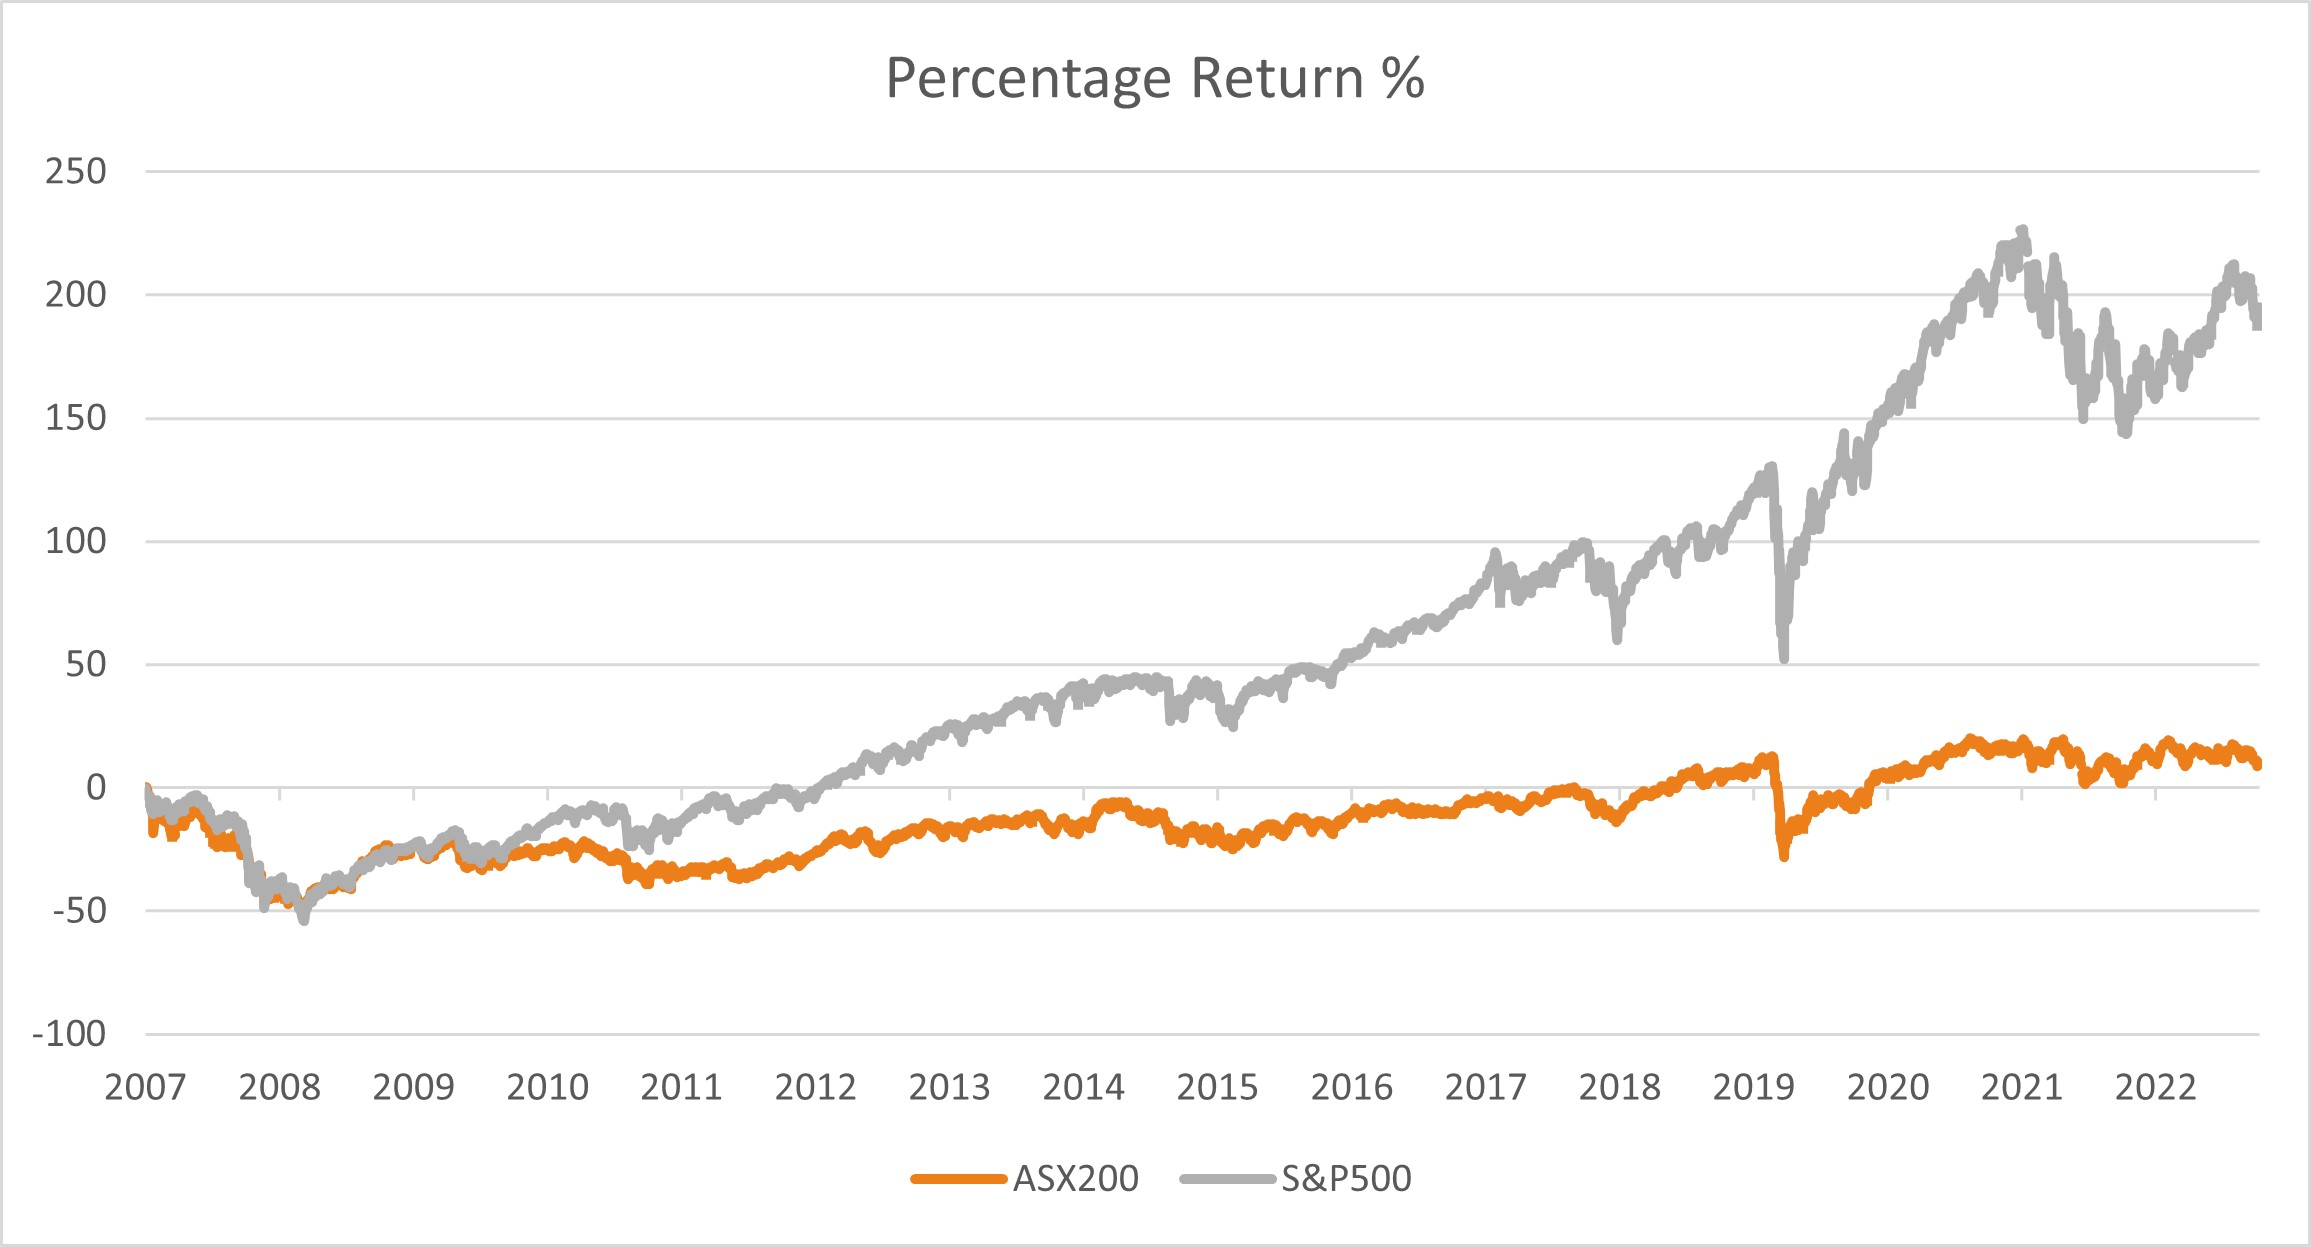
Unfortunately for Aussie investors, the ASX, although still correlated to US markets, has underperformed the US since the global financial crisis in 2008. The chart below shows the total return of each of the ASX200 (blue) and S&P500 (orange) since the beginning of 2008. Over this period, the S&P500 has risen 305% compared to 119% gains for the ASX200.

Source: Rivkin, Bloomberg
The chart shows that both markets had very similar performance during the financial crisis of 2008 and even into the beginnings of the recovery in 2009. Early in 2010, however, the lines deviated and the S&P began to outperform the ASX.
Why has this deviation occurred? The relative performance of the US and Australian economies does not provide an answer to this question. All else being equal, on average, companies in an economy with strong economic growth should perform better than companies in a weak economy. Strong stock market performance can potentially be linked to a high rate of economic growth in the country as a whole.
As the most widely used estimate of economic strength, real GDP growth (which accounts for inflation) can be used to compare the US economy with the Australian economy. Since 2008, the average annual GDP growth in Australia has been 2.56% while in the US it was almost three-quarters of a percent lower at 1.81%. These numbers indicate that GDP growth cannot be used to explain the difference in stock market performance over this period.

Source: Rivkin, Bloomberg
The next possibility is that price/earnings (P/E) ratios have increased for the S&P relative to the ASX. The P/E ratio measures the share price of a company relative to its earnings. Although a little simplistic, a high ratio implies that the share price is high for a given level of earnings and therefore the company is ‘expensive’. Conversely, a low ratio implies a company is ‘cheap’. More importantly, a rising P/E ratio would allow stock prices to rise without a corresponding increase in earnings.

Source: Rivkin, Bloomberg
If ASX and S&P500 companies were performing similarly well, in terms of underlying business results, a relatively higher P/E on the S&P500 would explain the higher index value. As it happens, the P/E ratio of the S&P500 at the beginning of 2008 was 18.24, and today’s value is 21.25. In comparison, for the ASX 200, the 2008 and 2023 values are 15.79 and 15.42 respectively. That is a 16.5% increase for the United States while Australian valuations are modestly lower. While the larger increase in the P/E ratio explains some of the outperformance of the S&P500, given the difference is rather small, it cannot be the full story.
Perhaps we need to keep digging to find differences.
The dividend yield gives a measure of how much capital companies are paying out in dividends rather than retaining as earnings. For the ASX200, the dividend yield is around 4.27%, which compares to just 1.60 % for the S&P500. Specifically, the dividend payout ratio specifies what percentage of a company’s earnings are paid out as dividends. Based on the dividend yield and P/E ratios above, the payout ratio for the ASX 200 is currently around 72.5%, while for the S&P500 it is 38.2%, indicating that significantly more earnings are being reinvested in the US compared to Australia (although this doesn’t account for money used for stock buybacks which are heavily utilised by US corporations).

Source: Rivkin, Bloomberg
Reinvested earnings can be used to grow the company and increase future earnings. Therefore it is generally not good for growth if a too high percentage of earnings is paid out as dividends. This may certainly be a contributing factor to the relative underperformance of the Australian market.
In fact, the graph above does not tell the full story, because it doesn’t include the effect of dividend payments. If we include dividend payments and compound them, the performance of the two indices becomes much closer, as shown in the chart below.

Source: Rivkin, Bloomberg
Even accounting for dividends and higher P/E ratios, the S&P 500 has still outperformed the ASX 200. This implies that company earnings growth in the US has outpaced ASX stocks despite the overall sluggish GDP growth.
There could be a few factors at play in this. The US Federal Reserve has implemented an unprecedented stimulus program since the Global Financial Crisis, coupled with fiscal stimulus in response to the COVID-19 pandemic, injecting hundreds of billions of dollars into the economy. A lot of this money has flowed into Wall Street and probably contributed to the earnings growth of some large US companies. On the other hand, Australian resource companies (which are a large part of our economy) are more exposed to changes in commodities, going through periods of boom and bust, in particular tied to the Chinese economy which has remained subdued since the outbreak of the COVID-19 pandemic, and more recently a highly indebted and struggling real estate sector. This has weighed on the outlook for some of the largest listed Australian companies.
On an annualised basis, the outperformance of the S&P 500 could be as much as 4.1%, which makes a big difference to a portfolio when compounded over several years and highlights one of the benefits of including international markets in a stock portfolio.
Investors wishing to diversify into international stocks could consider one of our US that trades in S&P 100 and Nasdaq 100 stocks (as well as many others). For more information, just give us a call at 1 300 748 546, use the chatbox in the lower right corner, or click here to send us an email.
Please note that all data is accurate as of October 2023.


